
The Nom Healthy Fast Food Report
We graded the 810 main dishes on the national menus of 21 fast-food chains, from each chain’s own nutrition figures, dated June 2025 to November 2026. 24% earn an A or B on the Nom Score.
10 findings from 21 chains’ main dishes
Each finding has its own link and says what it counted. Chipotle, counted per whole order, and the 9 chains not ranked are in the chain table with their figures.
-
Of the 810 main dishes, 24% earn an A or B on the Nom Score; 69% grade C, the most common grade.
How we counted: 810 main dishes at 21 chains, graded A 8, B 183, C 557, D 58, F 4. Link to this finding
-
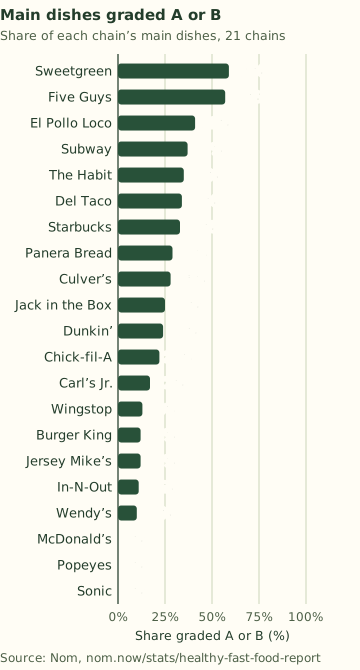
Sweetgreen has the largest share of main dishes graded A or B, 59% of its 22, followed by Five Guys (57%) and El Pollo Loco (41%).
How we counted: Each chain’s main dishes graded A or B, as a share of its main dishes, across 21 chains. Link to this finding
-
At 3 of the 21 chains, no main dish earns an A or B: McDonald’s (34 main dishes), Popeyes (17), and Sonic Drive-In (24).
How we counted: Every main dish at each of the 21 chains, graded by the Nom Score. Link to this finding
-
The median main dish has 550 calories, 1,320 mg of sodium and 28 g of protein.
How we counted: The middle value across the 810 main dishes at 21 chains; sodium as the chain publishes it, for 810 of the 810. Link to this finding
-
77 main dishes, 10% of the 810 that publish sodium, carry a full day’s sodium in one item, 2,300 mg or more; Panera Bread has the most, 15.
How we counted: Main dishes with at least 2,300 mg of sodium, the Daily Value on US nutrition labels, at 21 chains. Link to this finding
-
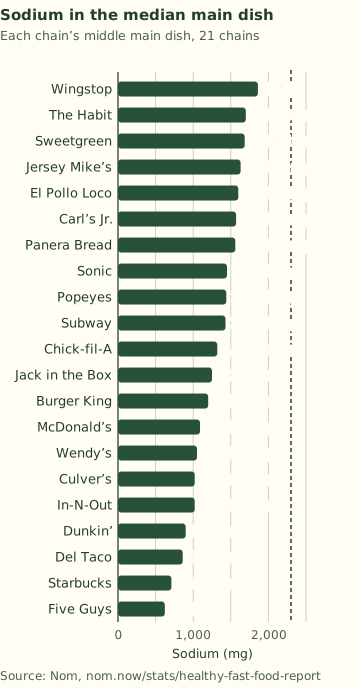
Wingstop’s median main dish carries the most sodium, 1,860 mg; Five Guys’ carries the least, 623 mg.
How we counted: Each chain’s middle sodium value across its main dishes, 21 chains. Link to this finding
-
El Pollo Loco’s main dishes carry the most protein per calorie, 6.9 g per 100 calories; Dunkin’s carry the least, 3.9 g.
How we counted: Each chain’s total protein divided by its total calories across its main dishes, 21 chains. Link to this finding
-
Panera Bread’s main dishes span the widest range of Nom Scores, from 30 to 81 out of 100.
How we counted: The lowest and highest Nom Score among each chain’s main dishes, 21 chains. Link to this finding
-
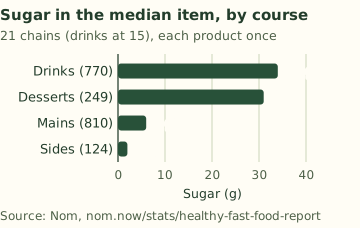
The median drink has 34 g of sugar and the median dessert 31 g, against 6 g for the median main dish and 2 g for the median side.
How we counted: 770 drinks at 15 chains, 249 desserts at 21 chains, 810 main dishes at 21 chains, 124 sides at 19 chains, each product once at its middle size; kids’ and 55+ items and family sizes left out. Link to this finding
-
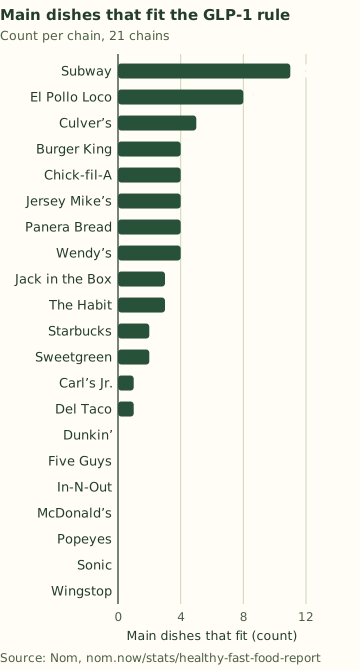
56 of the 810 main dishes (7%) fit Nom’s GLP-1 rule for small, protein-first meals; Subway has the most, 11, and 7 of the 21 chains have none. See the GLP-1 section.
How we counted: 810 main dishes at 21 chains, checked against the rule set out in the GLP-1 section. Link to this finding
The chains, charted
Every bar starts at zero, and each chart names what it counts. Each one can be downloaded and shared with its source line.
This chart as a table
| Chain | Sodium (mg) |
|---|---|
| Wingstop | 1,860 mg |
| The Habit | 1,700 mg |
| Sweetgreen | 1,685 mg |
| Jersey Mike’s | 1,630 mg |
| El Pollo Loco | 1,600 mg |
| Carl’s Jr. | 1,570 mg |
| Panera Bread | 1,560 mg |
| Sonic | 1,450 mg |
| Popeyes | 1,440 mg |
| Subway | 1,430 mg |
| Chick-fil-A | 1,320 mg |
| Jack in the Box | 1,250 mg |
| Burger King | 1,200 mg |
| McDonald’s | 1,090 mg |
| Wendy’s | 1,050 mg |
| Culver’s | 1,020 mg |
| In-N-Out | 1,020 mg |
| Dunkin’ | 900 mg |
| Del Taco | 860 mg |
| Starbucks | 710 mg |
| Five Guys | 623 mg |
This chart as a table
| Course (products) | Sugar (g) |
|---|---|
| Drinks (770) | 34 g |
| Desserts (249) | 31 g |
| Mains (810) | 6 g |
| Sides (124) | 2 g |
GLP-1: what the menus offer small, protein-first meals
GLP-1 medications such as semaglutide (Ozempic, Wegovy) curb appetite and slow how fast the stomach empties (Ghusn 2024). Consensus guidance for people taking them advises higher protein, about 1.2–1.5 g per kg of body weight a day, or roughly 25–30% of calories on a 1,600-calorie day, and avoiding high-fat foods (Sievenpiper 2025).
Nom’s GLP-1 rule applies that protein share to each dish. A main dish fits when it has:
- at least 15 g of protein
- at least 25% of its calories from protein
- 600 calories or fewer
- 12 g of sugar or less
- 10 g of saturated fat or less, where the chain publishes it
- not breaded or fried, by its name, its menu section, the chain’s description or its ingredient statement
These lines are Nom’s own, the rule its GLP-1 guides use; the sources above explain its shape, not each number.
56 of the 810 main dishes at the 21 chains fit the rule, 7%. Subway has the most that fit, 11 of 89; El Pollo Loco has the largest share, 30% (8 of 27). At 7 of the 21 chains, no main dish fits: Dunkin’, Five Guys, In-N-Out Burger, McDonald’s, Popeyes, Sonic Drive-In, and Wingstop.
Of the 754 main dishes that miss, 84% get less than 25% of their calories from protein, 46% carry more than 10 g of saturated fat, and 45% run over 600 calories; a dish can miss on more than one line.
This chart as a table
| Chain | Main dishes that fit (count) |
|---|---|
| Subway | 11 |
| El Pollo Loco | 8 |
| Culver’s | 5 |
| Burger King | 4 |
| Chick-fil-A | 4 |
| Jersey Mike’s | 4 |
| Panera Bread | 4 |
| Wendy’s | 4 |
| Jack in the Box | 3 |
| The Habit | 3 |
| Starbucks | 2 |
| Sweetgreen | 2 |
| Carl’s Jr. | 1 |
| Del Taco | 1 |
| Dunkin’ | 0 |
| Five Guys | 0 |
| In-N-Out | 0 |
| McDonald’s | 0 |
| Popeyes | 0 |
| Sonic | 0 |
| Wingstop | 0 |
The best-scoring main dish that fits, chain by chain
| Chain | Main dishes that fit | Share | Best-scoring main dish that fits |
|---|---|---|---|
| Subway GLP-1 guide | 11 of 89 | 12% | Fresh Fit Grilled Chicken Sub Nom Score 79 (B), 300 calories, 26 g protein |
| El Pollo Loco GLP-1 guide | 8 of 27 | 30% | Taco al Carbón Nom Score 84 (A), 170 calories, 15 g protein |
| Culver’s GLP-1 guide | 5 of 46 | 11% | Chicken Cashew Salad with Grilled Chicken Nom Score 81 (A), 430 calories, 41 g protein |
| Burger King | 4 of 75 | 5% | Flame-Grilled Chicken Sandwich Nom Score 73 (B), 410 calories, 35 g protein |
| Chick-fil-A | 4 of 27 | 15% | Grilled Chicken Sandwich Nom Score 72 (B), 390 calories, 28 g protein |
| Jersey Mike’s Subs GLP-1 guide | 4 of 52 | 8% | #5 Breakfast Sandwich (Roast Beef, Egg & Cheese) Nom Score 66 (B), 510 calories, 40 g protein |
| Panera Bread | 4 of 80 | 5% | Frontega Chicken Wrap Nom Score 70 (B), 450 calories, 30 g protein |
| Wendy’s | 4 of 41 | 10% | Cobb Salad (without dressing) Nom Score 74 (B), 410 calories, 37 g protein |
| Jack in the Box | 3 of 52 | 6% | Southwest Salad with Grilled Chicken Nom Score 79 (B), 290 calories, 30 g protein |
| The Habit Burger Grill | 3 of 20 | 15% | Grilled Chicken Caesar Nom Score 77 (B), 580 calories, 43 g protein |
| Starbucks | 2 of 21 | 10% | Turkey Bacon, Cheddar & Egg White Sandwich Nom Score 69 (B), 260 calories, 17 g protein |
| Sweetgreen | 2 of 22 | 9% | Buffalo Chicken Nom Score 73 (B), 580 calories, 37 g protein |
| Carl’s Jr. | 1 of 29 | 3% | Charbroiled BBQ Chicken Sandwich Nom Score 69 (B), 440 calories, 35 g protein |
| Del Taco | 1 of 58 | 2% | Breakfast Big Fat Taco (Carnitas) Nom Score 82 (A), 380 calories, 24 g protein |
| Dunkin’ | 0 of 21 | 0% | None fits |
| Five Guys | 0 of 14 | 0% | None fits |
| In-N-Out Burger | 0 of 9 | 0% | None fits |
| McDonald’s | 0 of 34 | 0% | None fits |
| Popeyes | 0 of 17 | 0% | None fits |
| Sonic Drive-In | 0 of 24 | 0% | None fits |
| Wingstop | 0 of 52 | 0% | None fits |
| Chipotle Per whole order GLP-1 guide | 84 of 993 orders | 8% | a chicken burrito bowl with brown rice and black beans Nom Score 86 (A), 520 calories, 44 g protein |
Chipotle is counted over whole orders built from its own per-portion figures, so its row is not ranked against the others. More picks: GLP-1 fast food options.
This is food guidance, not medical advice: your medication, any side effects and your targets are a conversation for your clinician.
Every chain, side by side
One row per chain, its main dishes counted as in the findings. The ranked chains are sorted by the share graded A or B; select a column heading to sort them by it. Download the table (CSV).
| Chain | Source and date | Main dishes | Graded A or B | Median calories | Median sodium (mg) | Median protein (g) | Mains with 2,300 mg+ sodium | Protein per 100 cal (g) | Nom Score range | Fit the GLP-1 rule |
|---|---|---|---|---|---|---|---|---|---|---|
| Ranked: 21 chains on their own dated figures | ||||||||||
| Sweetgreen | Own data, checked Nov 2026 | 22 | 59% 13 dishes | 715 | 1,685 | 36 | 6 | 4.6 | 45–76 | 2 |
| Five Guys | Own data, checked Nov 2026 | 14 | 57% 8 dishes | 615 | 623 | 32 | 0 | 4.8 | 54–71 | 0 |
| El Pollo Loco | Its Sep 2026 guide | 27 | 41% 11 dishes | 660 | 1,600 | 42 | 6 | 6.9 | 55–84 | 8 |
| Subway | Own data, checked Nov 2026 | 89 | 37% 33 dishes | 560 | 1,430 | 31 | 10 | 5.8 | 37–79 | 11 |
| The Habit Burger Grill | Own data, checked Nov 2026 | 20 | 35% 7 dishes | 580 | 1,700 | 32 | 2 | 5.3 | 52–77 | 3 |
| Del Taco | Own data, checked Nov 2026 | 58 | 34% 20 dishes | 380 | 860 | 18 | 6 | 4.7 | 49–86 | 1 |
| Starbucks | Own data, checked Jun 2026 | 21 | 33% 7 dishes | 360 | 710 | 19 | 0 | 4.8 | 49–77 | 2 |
| Panera Bread | Own data, checked Nov 2026 | 80 | 29% 23 dishes | 670 | 1,560 | 27 | 15 | 4.1 | 30–81 | 4 |
| Culver’s | Own data, checked Nov 2026 | 46 | 28% 13 dishes | 580 | 1,020 | 31 | 0 | 5.4 | 43–81 | 5 |
| Jack in the Box | Own data, checked Nov 2026 | 52 | 25% 13 dishes | 580 | 1,250 | 28 | 0 | 4.6 | 45–79 | 3 |
| Dunkin’ | Own data, checked Jun 2026 | 21 | 24% 5 dishes | 440 | 900 | 19 | 0 | 3.9 | 53–74 | 0 |
| Chick-fil-A | Own data, checked Nov 2026 | 27 | 22% 6 dishes | 450 | 1,320 | 27 | 0 | 5.8 | 52–77 | 4 |
| Carl’s Jr. | Its Jun 2025 guide | 29 | 17% 5 dishes | 690 | 1,570 | 34 | 3 | 4.7 | 47–70 | 1 |
| Wingstop | Own data, checked Nov 2026 | 52 | 13% 7 dishes | 600 | 1,860 | 30 | 14 | 6 | 42–82 | 0 |
| Burger King | Own data, checked Nov 2026 | 75 | 12% 9 dishes | 530 | 1,200 | 24 | 2 | 5 | 42–73 | 4 |
| Jersey Mike’s Subs | Own data, checked Nov 2026 | 52 | 12% 6 dishes | 730 | 1,630 | 39 | 9 | 5.4 | 43–81 | 4 |
| In-N-Out Burger | Own data, checked Nov 2026 | 9 | 11% 1 dish | 380 | 1,020 | 20 | 0 | 5.5 | 51–65 | 0 |
| Wendy’s | Own data, checked Nov 2026 | 41 | 10% 4 dishes | 470 | 1,050 | 27 | 0 | 5.4 | 45–74 | 4 |
| McDonald’s | Own data, checked Nov 2026 | 34 | 0% 0 dishes | 460 | 1,090 | 17 | 0 | 4.2 | 45–64 | 0 |
| Popeyes | Own data, checked Nov 2026 | 17 | 0% 0 dishes | 490 | 1,440 | 28 | 4 | 5.1 | 31–60 | 0 |
| Sonic Drive-In | Own data, checked Nov 2026 | 24 | 0% 0 dishes | 470 | 1,450 | 23 | 0 | 4.7 | 49–63 | 0 |
| Counted per whole order, not ranked against menu dishes | ||||||||||
| Chipotle Per whole order | Own data, checked Nov 2026 | 993 orders | 40% 394 orders | 760 | 1,790 | 36 | 230 | 4.5 | 45–86 | 84 |
| Not ranked: 9 chains, each with its reason below the table | ||||||||||
| Dairy Queen Not ranked: why | Own data | 17 | 6% 1 dish | 500 | 1,060 | 21 | 0 | 4.9 | 49–65 | 0 |
| IHOP Not ranked: why | fastfoodnutrition.org | 45 | 16% 7 dishes | 901 | 1,870 | 41 | 12 | 5.2 | 45–78 | 4 |
| Jimmy John’s Not ranked: why | Its Jul 2024 guide | 50 | 38% 19 dishes | 500 | 1,340 | 30 | 8 | 5.8 | 45–74 | 8 |
| KFC Not ranked: why | Own data, checked Feb 2026 | 35 | 23% 8 dishes | 280 | 730 | 15 | 1 | 5.9 | 51–67 | 6 |
| Panda Express Not ranked: why | fastfoodnutrition.org | 22 | 55% 12 dishes | 300 | 620 | 14 | 0 | 6.1 | 44–80 | 4 |
| Raising Cane’s Not ranked: why | Its Jul 2025 guide | 9 | 0% 0 dishes | 830 | 1,500 | 51 | 1 | 6 | 60–60 | 0 |
| Shake Shack Not ranked: why | Own data, checked Jan 2026 | 24 | 13% 3 dishes | 550 | 1,250 | 29 | 3 | 5.7 | 46–74 | 1 |
| Taco Bell Not ranked: why | Own data, checked Feb 2026 | 71 | 58% 41 dishes | 450 | 1,093 | 18 | 0 | 3.9 | 55–85 | 0 |
| Whataburger Not ranked: why | Its Mar 2021 guide | 38 | 18% 7 dishes | 490 | 1,190 | 29 | 3 | 5.3 | 50–77 | 5 |
- Dairy Queen: No date is recorded for its figures.
- IHOP: Its figures come from a third-party nutrition site (Fastfoodnutrition.org), not from IHOP’s own documents.
- Jimmy John’s: Its figures are from Jimmy John’s July 2024 guide, more than 18 months older than the newest figures here.
- KFC: Its figures are being sourced again from KFC’s own site, because the document they came from was not recorded.
- Panda Express: Its figures come from a third-party nutrition site (Fastfoodnutrition.org), not from Panda Express’ own documents.
- Raising Cane’s: Its figures are from Raising Cane’s July 2025 guide, and Raising Cane’s own menu now prints different figures for some items, so a newer edition is being sourced.
- Shake Shack: Its figures were typed in by hand in January 2026 and are being sourced again from Shake Shack’s own documents.
- Taco Bell: Some of its rows show Taco Bell’s figures before the rounding its printed labels use, and are waiting for Taco Bell’s printed table.
- Whataburger: Its figures are from Whataburger’s March 2021 guide, more than 18 months older than the newest figures here.
How we counted
Main dishes. A main dish is a dish served as the meal: burgers, sandwiches, subs, wraps, bowls, salads with a protein, tacos, burritos, chicken pieces, wings, soups and breakfast sandwiches, whatever the chain calls the section. Sides, desserts, bakery items, sweet breakfasts, snacks, drinks and sauces are not, and neither are kids’ meals, 55+ items, and family or share sizes. Each product counts once, at its middle size by calories when the chain sells it in several sizes.
National menus only: a row the chain marks as regional, seasonal or sold at some locations only is left out.
Which chains are ranked. A chain is ranked when its figures come from its own documents, carry a date, are no more than 18 months older than the newest figures here (November 2026), and are not waiting on a known correction. 21 chains meet that. Chipotle meets it too, but its menu lists ingredients one by one, so it is counted over its 993 whole orders, each totalled from its own per-portion figures, and shown apart. The other 9 are in the chain table with the reason each is not ranked.
The Nom Score grades each dish from 0 to 100 and A to F, weighing sodium (30%), sugar (25%), saturated fat (20%), portion size (10%), fiber (10%), and protein (5%), with caps for fried food and for a full day’s sodium or saturated fat in one item. How the Nom Score works.
A median is the middle value; for an even count it is the lower of the two middle values. A figure the chain does not publish is left out rather than counted as zero.
Limits. These are the chains’ published figures for their standard recipes. Values may vary by location and change over time, and a chain’s figures reflect what it sells: a salad chain and a burger chain are different menus. The Nom Score is Nom’s formula, not a medical rating. Restaurant names and trademarks belong to their owners; Nom is an independent guide.
Each chain’s source and date
| Chain | Where its figures come from | Date | In the report |
|---|---|---|---|
| Burger King | Burger King’s US nutrition information, November 2026 (bk.com), with each item’s ingredient statement | Checked November 2026 | Ranked |
| Carl’s Jr. | Carl’s Jr.’s Nutritional Information poster, June 2025 edition (carlsjr.com) | From Carl’s Jr.’s June 2025 guide | Ranked |
| Chick-fil-A | Chick-fil-A’s Nutrition & Allergens table (chick-fil-a.com/nutrition-allergens, November 2026), with each item page’s ingredient statement | Checked November 2026 | Ranked |
| Chipotle | Chipotle’s online nutrition calculator (chipotle.com/nutrition-calculator, November 2026); cholesterol from Chipotle’s US nutrition facts PDF | Checked November 2026 | Per whole order |
| Culver’s | Culver’s Nutrition & Allergen Guide (culvers.com) data, which Nom rounds by US nutrition-label rules as the guide displays it; calories checked on culvers.com | Checked November 2026 | Ranked |
| Dairy Queen | Dairy Queen Nutrition & Allergen Guide (April 2025) | No date recorded | Not ranked |
| Del Taco | Del Taco’s Nutritional List and Allergen List, September 2026 (deltaco.com), with each item’s ingredient statement | Checked November 2026 | Ranked |
| Dunkin’ | Dunkin’ nutrition PDF (dunkindonuts.com/content/dam/dd/pdf/nutrition.pdf) | Checked June 2026 | Ranked |
| El Pollo Loco | El Pollo Loco’s Nutrition Guide, September 2026 (elpolloloco.com) | From El Pollo Loco’s September 2026 guide | Ranked |
| Five Guys | Five Guys’ US Nutrition & Allergen Guide, September 2026 (fiveguys.com) | Checked November 2026 | Ranked |
| IHOP | Fastfoodnutrition.org | Third-party site | Not ranked |
| In-N-Out Burger | In-N-Out’s Nutrition Facts (January 2026) and Allergen Information chart (September 2026), in-n-out.com | Checked November 2026 | Ranked |
| Jack in the Box | Jack in the Box’s 2026 Nutrition Facts, effective November 2026 (jackinthebox.com) | Checked November 2026 | Ranked |
| Jersey Mike’s Subs | Jersey Mike’s nutrition guide, the Master Menu Label Report, November 2026 (jerseymikes.com), with each item’s ingredient statement | Checked November 2026 | Ranked |
| Jimmy John’s | Jimmy John’s Nutrition Guide (July 2024) and allergen chart (August 2024), with ingredients from its Ingredient Guide (November 2026) | From Jimmy John’s July 2024 guide | Not ranked |
| KFC | KFC’s website nutrition data (via Nutritionix) | Checked February 2026 | Not ranked |
| McDonald’s | McDonald’s US nutrition information (mcdonalds.com, November 2026) | Checked November 2026 | Ranked |
| Panda Express | Fastfoodnutrition.org | Third-party site | Not ranked |
| Panera Bread | Panera Bread Nutrition Guide and Allergen Guide, November 2026 (panerabread.com) | Checked November 2026 | Ranked |
| Popeyes | Popeyes’ USA Nutrition Guide and Allergen Information, November 2026 (popeyes.com) | Checked November 2026 | Ranked |
| Raising Cane’s | Raising Cane’s Allergen & Nutritional Information, July 2025 edition (raisingcanes.com) | From Raising Cane’s July 2025 guide | Not ranked |
| Shake Shack | Shakeshack.com nutrition PDF | Checked January 2026 | Not ranked |
| Sonic Drive-In | Sonic’s Fall 2026 nutrition, allergen and ingredient guides (sonicdrivein.com) | Checked November 2026 | Ranked |
| Starbucks | Starbucks.com ordering-API nutrition data | Checked June 2026 | Ranked |
| Subway | Subway U.S. Nutrition Information, October 2026 (subway.com) | Checked November 2026 | Ranked |
| Sweetgreen | Sweetgreen’s nutrition guide (sweetgreen.com) | Checked November 2026 | Ranked |
| Taco Bell | Taco Bell nutrition information (tacobell.com/nutrition) | Checked February 2026 | Not ranked |
| The Habit Burger Grill | The Habit Burger & Grill’s Nutrition & Allergen Information, as of June 2026 (habitburger.com) | Checked November 2026 | Ranked |
| Wendy’s | Wendy’s US nutrition information, November 2026 (wendys.com), with each item’s ingredient statement | Checked November 2026 | Ranked |
| Whataburger | Whataburger’s Nutrition PDF, March 2021 edition (whataburger.com) | From Whataburger’s March 2021 guide | Not ranked |
| Wingstop | Wingstop’s Nutritional Guide and Allergen / Sensitivity Declaration (wingstop.com) | Checked November 2026 | Ranked |
Cite this report
Nom. (n.d.). The Nom Healthy Fast Food Report: main dishes at 21 fast-food chains, figures dated June 2025 to November 2026. Retrieved from https://nom.now/stats/healthy-fast-food-report
To cite one finding, link its address, for example https://nom.now/stats/healthy-fast-food-report#finding-median-main.
You may quote the figures, the chain table and the charts on this page, and republish the charts, with credit to Nom and a link to this page.